Graph of a model
Visualizing the network of relationships between sensors
The graph of sensors interconnection enables to visualize through a condensed view what are the currently available relationships between the sensors.
This makes it possible to immediately see patterns showing which subsets of sensors are intimately linked. These links might be implied by the physical laws that govern this subset of sensors according to explicit relationships that hold independent of the context of excitation and use.
The graph of the sensors interconnection is available for the g2sys module and the GUI associated to the pwpol module as well.
Below is an example of a Graph view resulted from the use of g2sys in exploring the relationships that hold in a hydraulic rig system1:
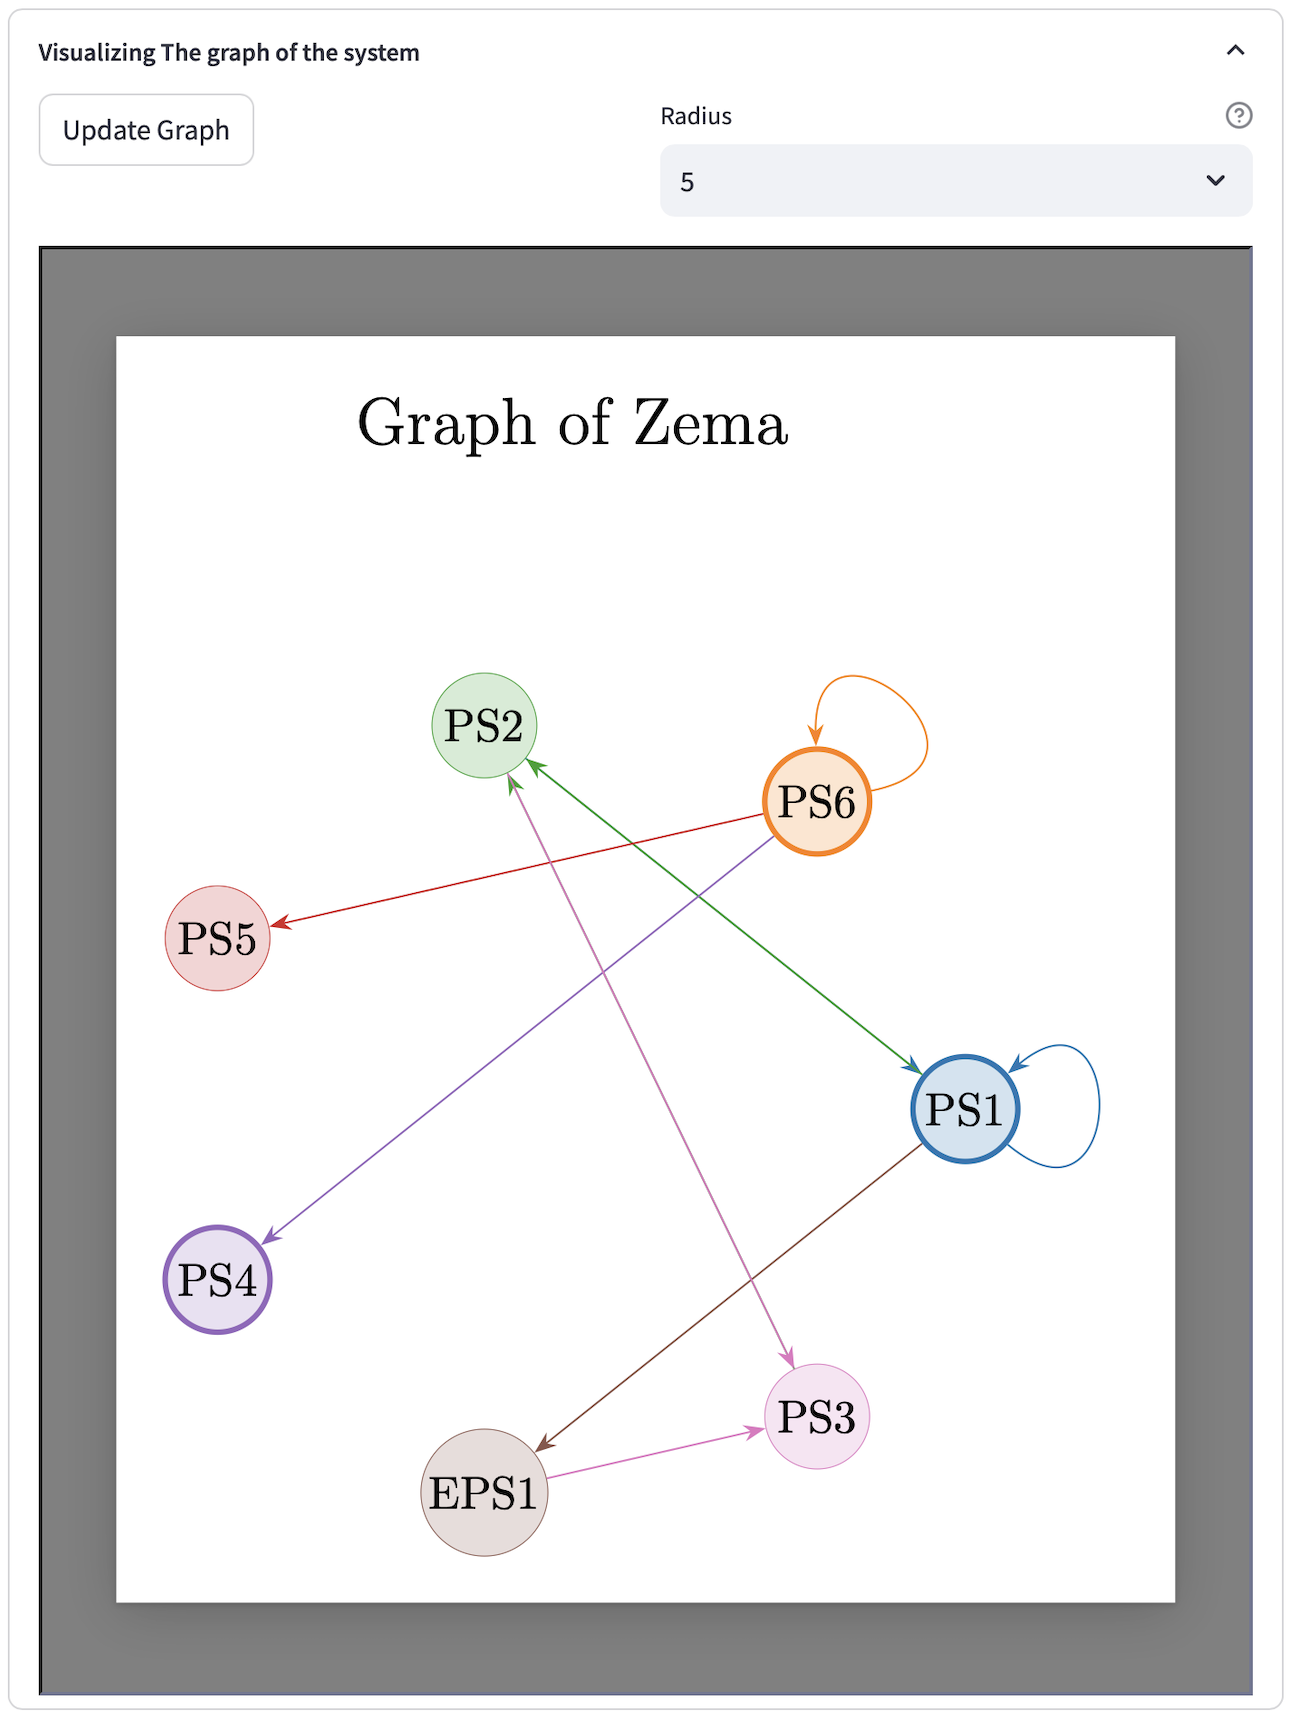
From this graph, the following facts can be infered:
There are three sensors appearing as the labels in recursive relationships. These are the sensors labelling nodes with thick boundaries, namely:
PS1,PS4andPS6.There is a static relationship that provides
PS2as a function ofPS1andPS3.EPS1statically depends onPS1and nothing else.PS6is an autonomous (probably oscillator or periodic variable).PS4appears in a recursive equations but it does not depends on itself. ProbablyPS4has the same derivative thanPS6. Moreover,PS4is not needed to build the simulator of the system as it does not impact any of the other sensors while it is dynamically intimately linked toPS6.
Notice that for the graph to be relevant, sensors should not have two relationships in the folder of models. In other words, for each sensor, there is at most one relationship where the sensor plays the role of a label.
Notice also that the distinction into recursive (or dynamic) and static relationships holds only for the graph of models that are designed using the g2sys module. Those built up using the pwpol module does not show this distinction.
For a video showing the creation of such a graph on the hydraulic rig system, please refer to the graph on the hydraulic rig system section.
It is also shown later on that the graph of models built up using g2sys might facilitate the design of an associated digital twin. Nevertheless, the following should be kept in mind:
There are two major facts regarding the use of MizoPol in designing digital twins:
The danger of open-loop simulations
It should be kept in mind that when dynamic relationships are involved, it is unrealistic tous the simulation model in open-loop as small identification errors might propagate along the simulation leading to totally erronous results. The dgital-twin is however useful in closed-loop mode as it gives the dependence (approximately) of the derivatices of some of the sensors in terms of other sensors.
The non-unicity of representation
Recall that MizoPol is about finging invariant relationships in the data. But the same relationship can be viewed in an infinite number of forms depending on the use of delays, the use of recursive vs non recursive form. Some invariance might be relevant in a rather poor training data which does not represent real dynamical/static laws. The use of non consistent relationship in a digital twin might lead to erronous prediction.
Footnotes
See the graph on the hydraulic rig system section for a detailed explanation.↩︎